




The Forgotten Cost of Cleanroom Downtime
Why recovery time matters more than build time
MRC panel systems are engineered from the outset to minimise operational downtime. Built using non-metallic composite materials to reduce the consequential risks of accidental damage, and designed for full in-situ repairability, they allow facilities to address damage, modifications, and routine maintenance without the disruptive tear-downs associated with traditional metal-skinned wall systems. With the MRC GRP system, a damaged panel face can be repaired in place, in hours rather than days, with no need to decommission the surrounding cleanroom envelope. This is not a peripheral feature — it is a deliberate response to the most underestimated cost in cleanroom ownership.

The build-time obsession
Most cleanroom procurement conversations gravitate toward a single question: how fast can it be built? Project timelines, GANTT charts, and contractual milestones all orbit around handover. It is the metric that gets boardroom attention, and understandably so — every week of delayed commissioning is a week of delayed revenue.
But build time is a one-off cost. Recovery time is a recurring one. And over a ten-year facility lifecycle, the cumulative impact of recovery events almost always outweighs the original build duration. A cleanroom that takes four months to construct but loses several weeks per year to repairs, modifications, and revalidation has, in cumulative terms, been rebuilt within its operational lifetime — at a cost that rarely appears in the original capex model.
Why traditional systems extend recovery time
Conventional metal-skinned cleanroom panels — typically powder-coated steel or aluminium honeycomb — present several recovery challenges. Damage to the panel face, whether from impact, chemical exposure, or wear, generally cannot be repaired in situ. The standard remediation is panel replacement, which means breaking the cleanroom envelope, decontaminating the affected zone, replacing the panel, resealing, and revalidating.
Modifications follow the same pattern. Adding a service penetration, relocating a pass-through, or extending a wall run typically requires hot work, dust generation, or both — all of which are incompatible with an operational cleanroom. The result is that even minor changes trigger zone-wide shutdowns. Over time, this creates a perverse incentive: facilities defer modifications they actually need, working around suboptimal layouts because the cost of changing them is too high. The cleanroom calcifies, and the operation adapts to the building rather than the other way round.
Case study: a mid-size GMP facility
To make the lifecycle argument concrete, consider a representative facility: a 500 m² Grade C/D cleanroom supporting sterile manufacturing on a single shift, with production value of approximately $57,000 per operating day, a very modest assumption. The procurement team is comparing two options — a traditional metal-panel system at $2.3M, and an MRC panel system at $3.0M. The MRC quote carries a 30% capex premium. On a like-for-like comparison at point of purchase, the traditional system wins.
Now extend the comparison across a ten-year operating lifecycle.
The downtime model
The lifecycle calculation rests on a small number of assumptions about how often a cleanroom needs intervention and how long each event takes. The model below assumes both systems experience the same frequency of underlying events — the difference is entirely in how each system handles them.
Assumption | Traditional | MRC |
Repair / modification events per year | 4 | 4 |
Average downtime per event | ~1.5 weeks | ~1–2 days |
Cumulative downtime per year | ~6 weeks | ~1.2 weeks |
Cumulative downtime over 10 years | 60 weeks | 12 weeks |
Four events per year is a moderate, realistic figure for an active sterile manufacturing facility — covering occasional impact damage, planned modifications, service penetrations, and reactive repairs. In a traditional metal-panel system, each event typically requires breaking the cleanroom envelope: decontamination, panel replacement or hot work, resealing, and operational qualification before production resumes. One and a half weeks per event is conservative — many facilities report longer.
With MRC's in-situ repair and zone-isolation approach, the same underlying events resolve in one to two days. Most repairs do not require breaking the envelope, and zone isolation contains any disruption to the immediate area rather than shutting down the suite.
Building up the lifecycle cost
Repair labour and materials. At roughly 40 events over a decade, traditional repairs average around $60,000 per event once specialist contractors, replacement panels, decontamination, sealing, and out-of-hours premiums are accounted for — a cumulative $2.4M. MRC repairs, conducted in-situ with composite repair materials and standard labour, average closer to $15,000 per event, totalling $0.6M.
OQ revalidation. When a cleanroom envelope is breached, operational qualification must be re-run before production resumes — particle count studies, airflow velocity and pattern verification, and recovery rate testing, with the supporting documentation. Roughly 30 of the 40 traditional events require full envelope-breach revalidation at around $25,000 each, totalling $0.8M. For MRC, only a handful of events are large enough to trigger formal OQ revalidation — closer to $0.1M over the period. This figure covers OQ only; PQ revalidation, where required, would push costs significantly higher.
Lost production revenue. This is the largest line by an order of magnitude. At $57,000 per operating day, every week of unplanned downtime represents roughly $285,000 of foregone revenue. Across a ten-year lifecycle, traditional facilities lose around 60 weeks of cumulative downtime — approximately $17.1M in lost output. MRC facilities, with recovery measured in days rather than weeks for most events, lose closer to 12 weeks, or $3.4M.
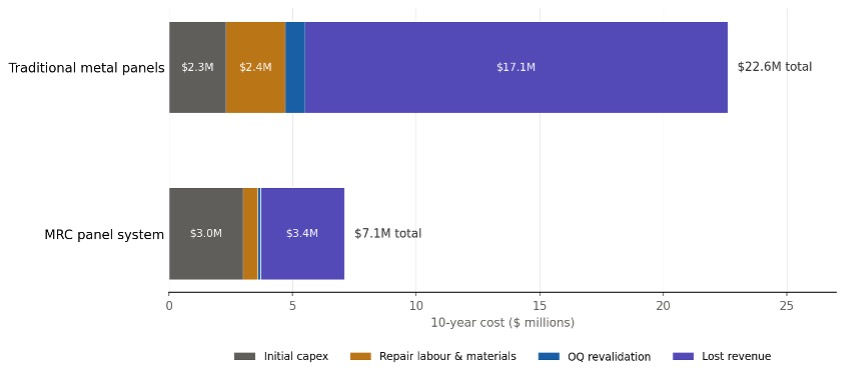
Ten-year total cost of ownership: traditional metal panels vs MRC panel system
Cost component | Traditional | MRC | Delta |
Initial capex (panel system) | $2.3M | $3.0M | +$0.7M |
Repair labour & materials | $2.4M | $0.6M | −$1.8M |
OQ revalidation | $0.8M | $0.1M | −$0.7M |
Lost production revenue | $17.1M | $3.4M | −$13.7M |
Total 10-year cost | $22.6M | $7.1M | −$15.5M |
Inverting the procurement frame
The $700,000 capex premium is the figure that dominates the procurement comparison, and on a like-for-like quote it is the figure that loses MRC the conversation when capex is the only metric considered. When the same comparison is extended to ten-year total cost of ownership, the framing inverts. That premium is recovered many times over through reduced repair costs, reduced revalidation cycles, and — most significantly — production revenue that simply continues uninterrupted.
For a facility of this scale, the capex premium pays back within roughly the first 18 months of operation. Everything beyond that is margin. The MRC system is not the cheaper system at point of purchase. It is, by a substantial margin, the cheaper system to own.
The metric that matters
For facility owners evaluating cleanroom systems, the question worth asking is not only how quickly can this be built, but how quickly can this be recovered — and how often will recovery be needed across the next ten years. The answers to those questions will tell you considerably more about total cost of ownership than the build quote ever will.
Build time is a sprint. Recovery time is the marathon. And the facilities that win on lifecycle economics are the ones designed for both.
CONTACT MRC to see how we can help you save money on your next cleanroom build
Note on assumptions
Figures are illustrative, based on a representative mid-size sterile GMP facility. Production value of $57,000/day reflects mid-range fill-finish operations; high-value biologics or cell therapy facilities will see proportionally larger lost-revenue figures. Event frequency, per-event downtime, and unit costs are indicative ranges typical of sterile manufacturing operations; actual figures will vary by sector, scale, and operational profile. Real client data from completed projects can substantially refine the model.


